
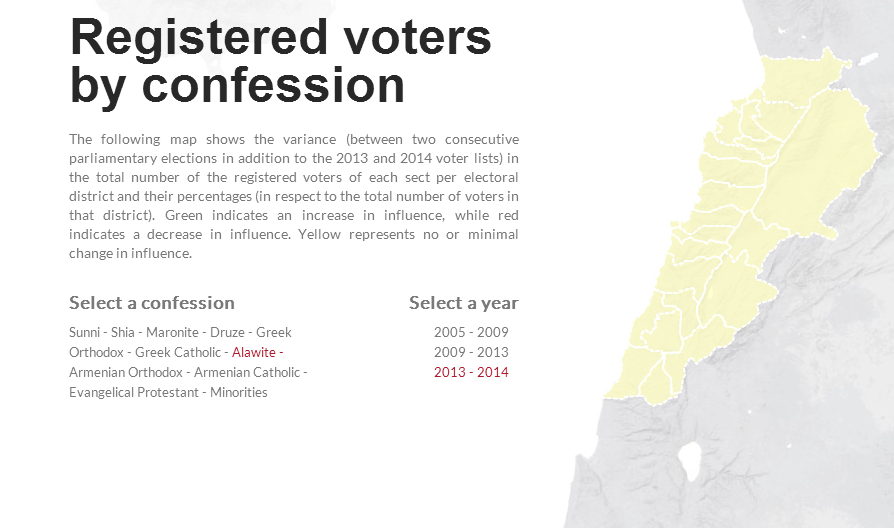
Electoral map of Lebanon according to the modified 1960 law of 2008
Lebanese like four things: Speculation, religion, percentages, and rankings. What is the fastest growing sect? In 25 years, what religious group will be the biggest? What religious groups are shrinking in size? Where? Every Lebanese citizen asked himself at least once these questions. Perhaps because of a trans-sectarian fear of becoming a minority, or perhaps because of simple curiosity. For a country with no census since 1932, the closest thing officially available and that is constantly updated is the electoral data. The Lebanese Association for Democratic Elections (LADE) created an amazing and extremely useful website, lebanonelectiondata.org where you’ll find visualizations on trends in voter registration by confession, gender, as well as white ballots cast and voter representation in parliament. The amount of information offered is too huge but it’s also extremely organized and simple.
All the following maps are taken from the website, and in case you’re interested to know the exact percentage for every district – the maps are based on the modified 1960 electoral law of 2008 – don’t hesitate to check their website (simply click on the district of your choice in the interactive map). And for those of you who prefer Excel tables instead of maps, you can find what you’re searching for here.
A- Confession Trends
a- Maronite

Map 1: Maronite influence change between 2005 and 2009
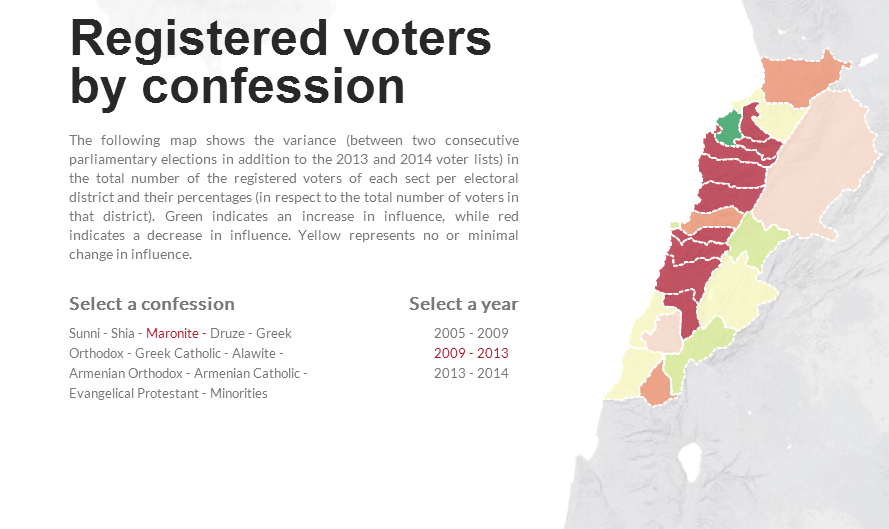
Map 2: Maronite influence change between 2009 and 2013

Map 3: Maronite influence change between 2013 and 2014
b- Greek Orthodox
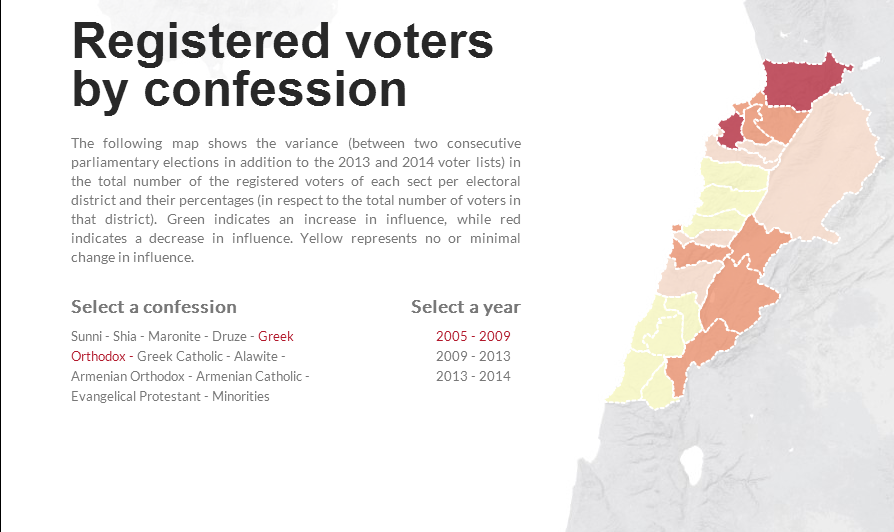
Map 4: Greek Orthodox influence change between 2005 and 2009
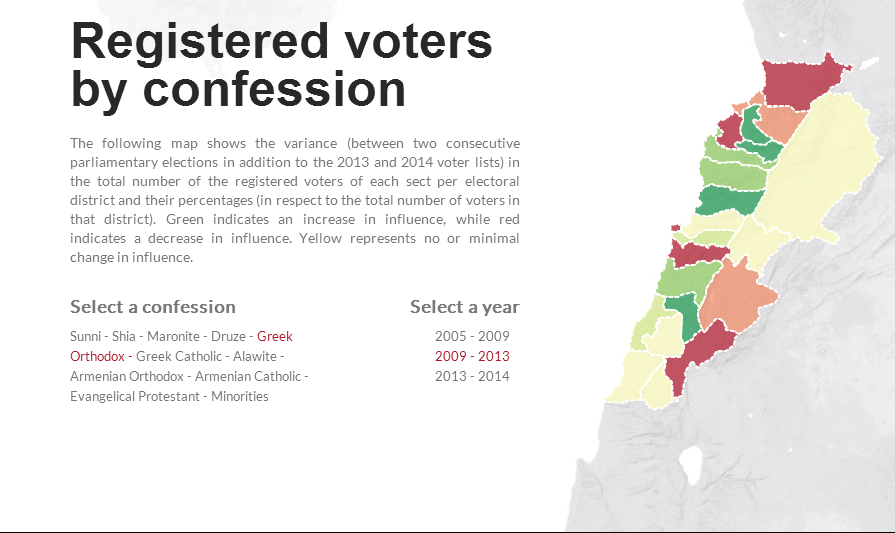
Map 5: Greek Orthodox influence change between 2009 and 2013
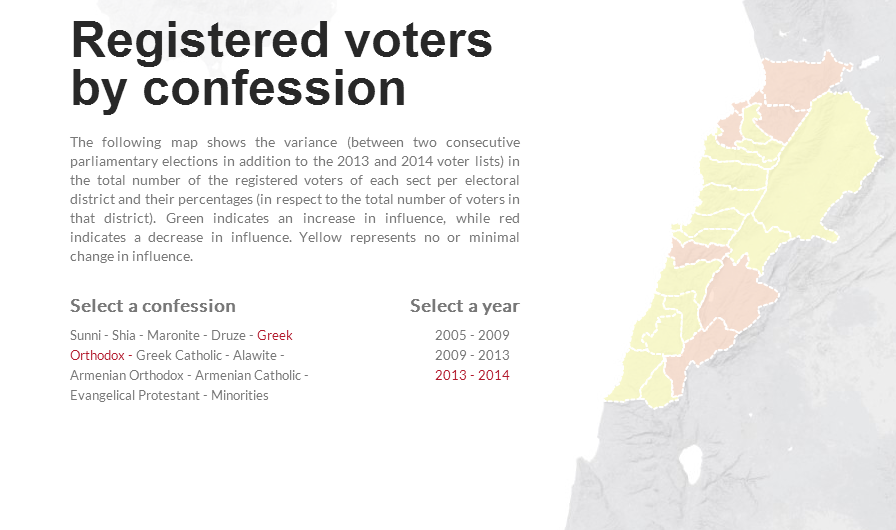
Map 6: Greek Orthodox influence change between 2013 and 2014
c- Greek Catholic
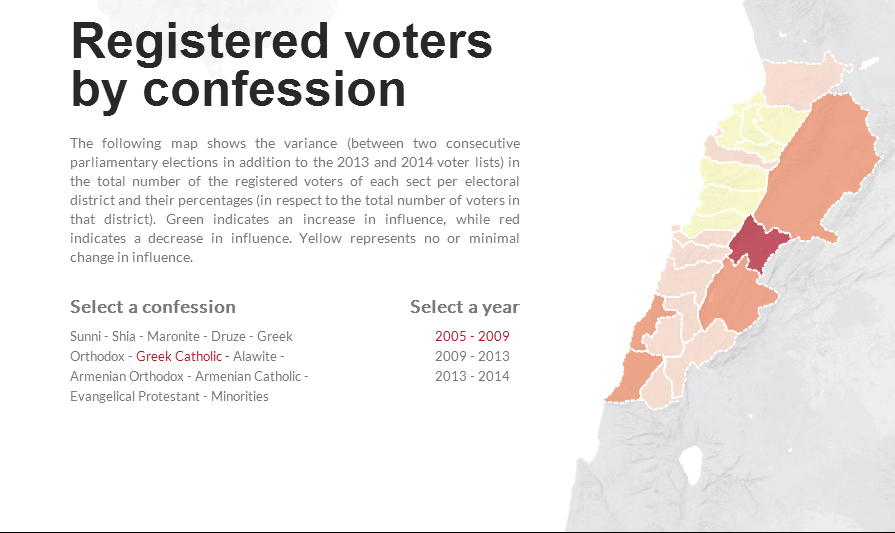
Map 7: Greek Catholic influence change between 2005 and 2009
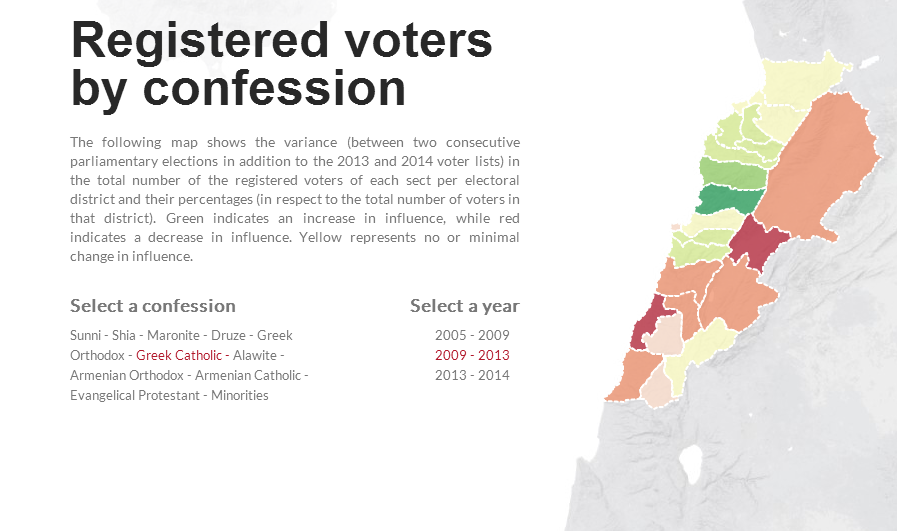
Map 8: Greek Catholic influence change between 2009 and 2013

Map 9: Greek Catholic influence change between 2013 and 2014
d- Armenian Orthodox

Map 10: Armenian Orthodox influence change between 2005 and 2009
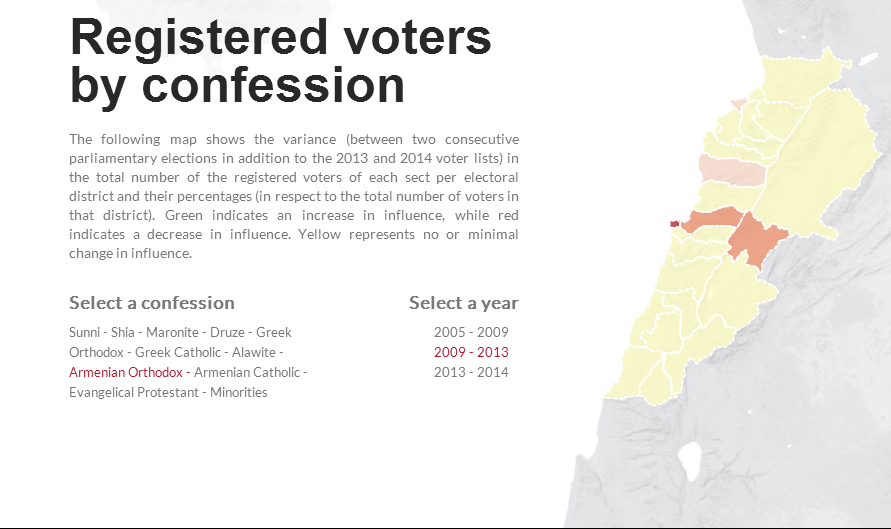
Map 11: Armenian Orthodox influence change between 2009 and 2013

Map 12: Armenian Orthodox influence change between 2013 and 2014
e- Armenian Catholic
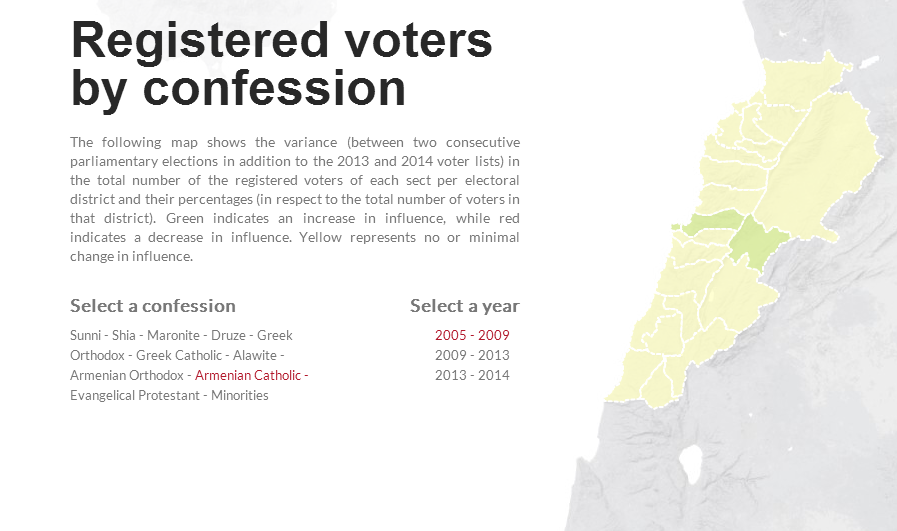
Map 13: Armenian Catholic influence change between 2005 and 2009

Map 14: Armenian Catholic influence change between 2009 and 2013

Map 15: Armenian Catholic influence change between 2013 and 2014
f- Protestant
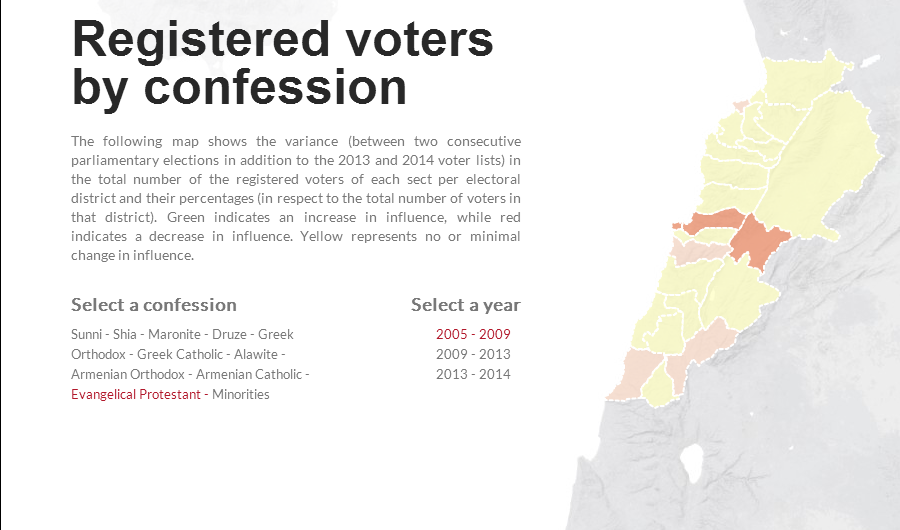
Map 16: Protestant influence change between 2005 and 2009

Map 17: Protestant influence change between 2009 and 2013
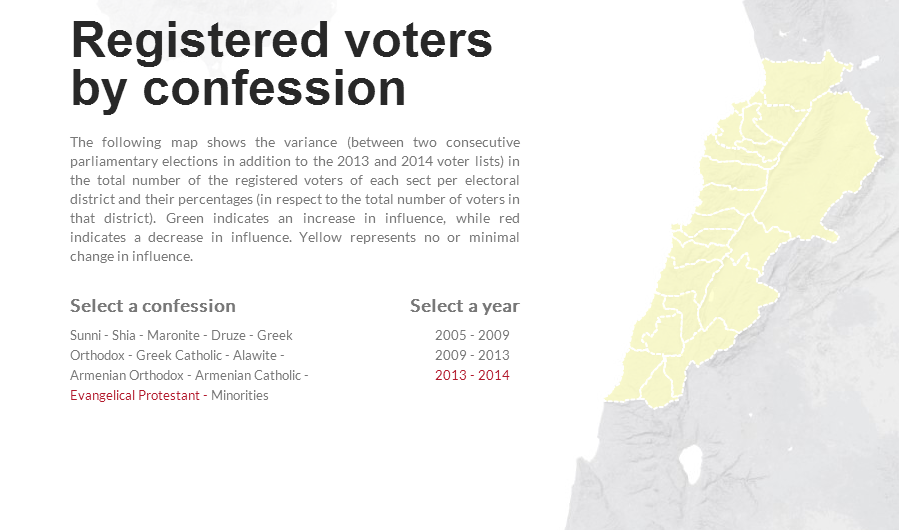
Map 18: Protestant influence change between 2013 and 2014
g- Christian Minorities

Map 19: Minorities influence change between 2005 and 2009
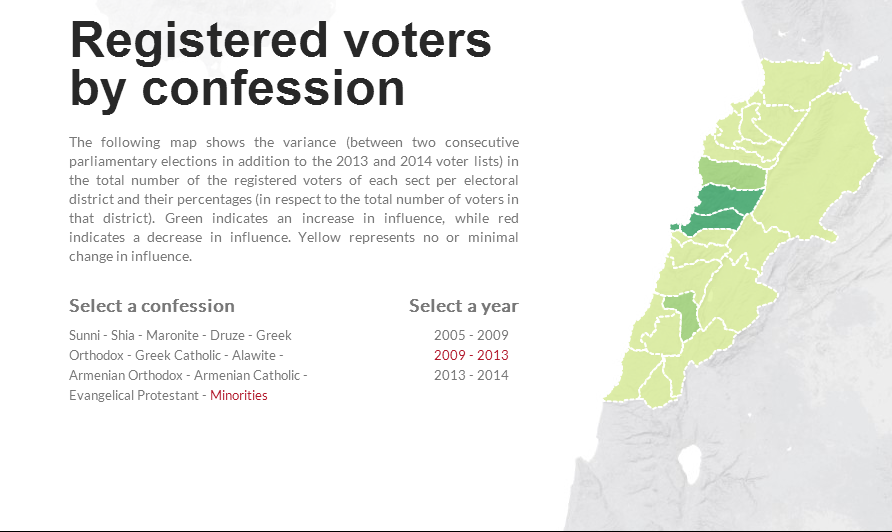
Map 20: Minorities influence change between 2009 and 2013

Map 21: Minorities influence change between 2013 and 2014
h- Sunni
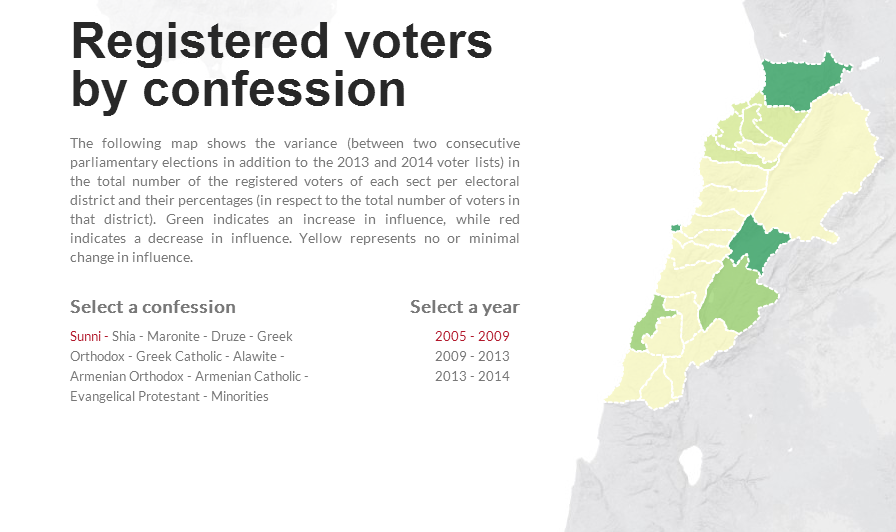
Map 22: Sunni influence change between 2005 and 2009

Map 23: Sunni influence change between 2009 and 2013

Map 24: Sunni influence change between 2013 and 2014
i- Shia
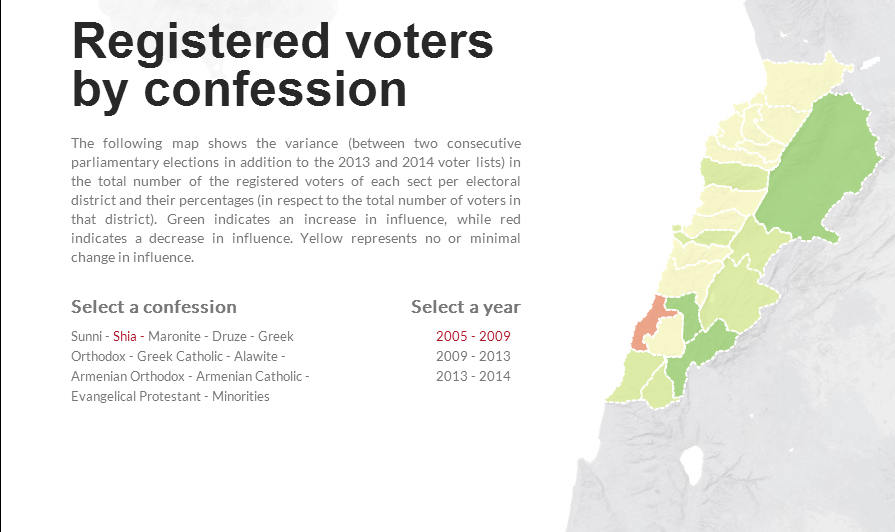
Map 25: Shia influence change between 2005 and 2009
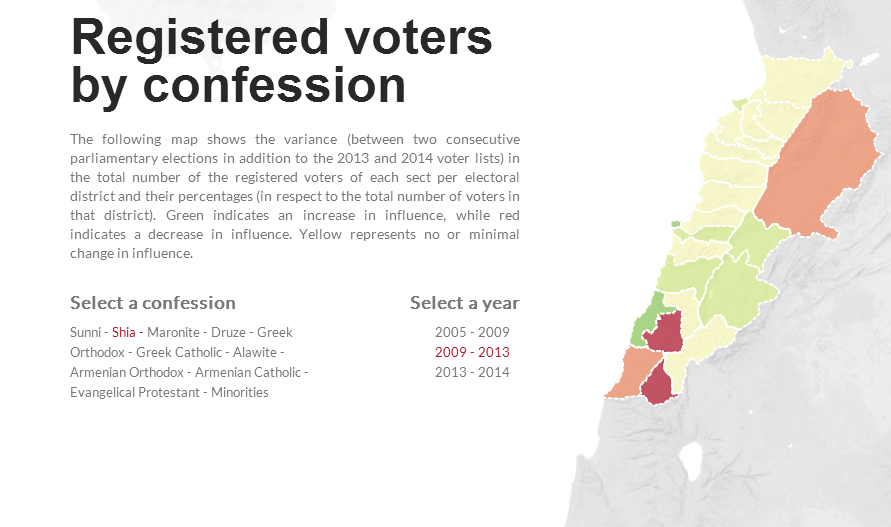
Map 26: Shia influence change between 2009 and 2013

Map 27: Shia influence change between 2013 and 2014
j- Druze

Map 28: Druze influence change between 2005 and 2009
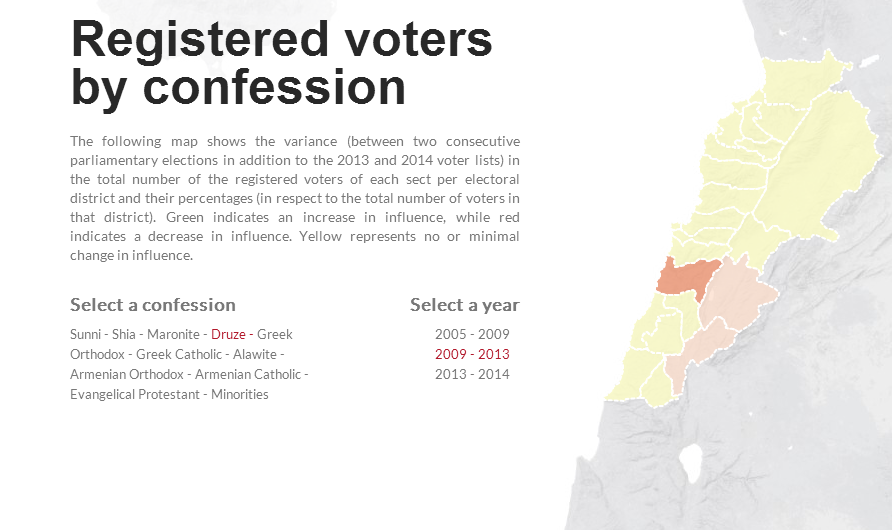
Map 29: Druze influence change between 2009 and2013

Map 30: Druze influence change between 2013 and 2014
k- Alawite
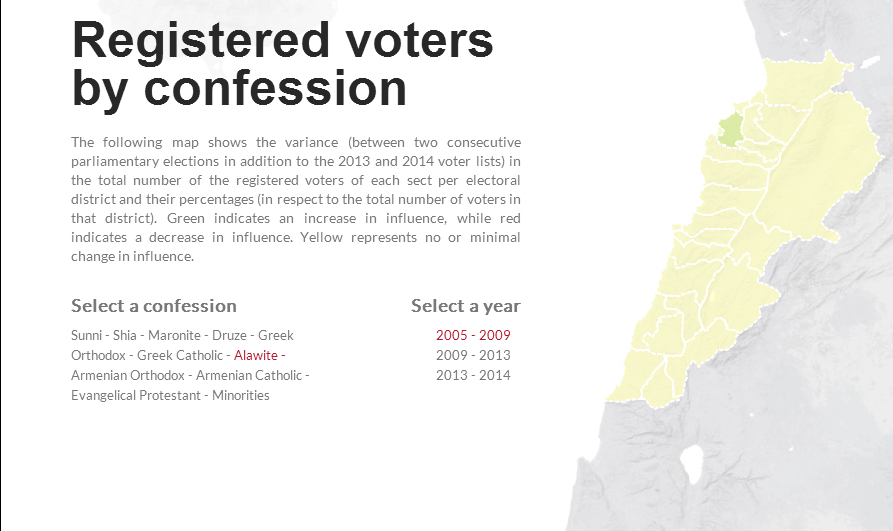
Map 31: Alawite influence change between 2005 and 2009

Map 32: Alawite influence change between 2009 and 2013
Map 33: Alawite influence change between 2013 and 2014
B- Gender Trends

Map 34: Influence by gender based on the 2009 voter registration
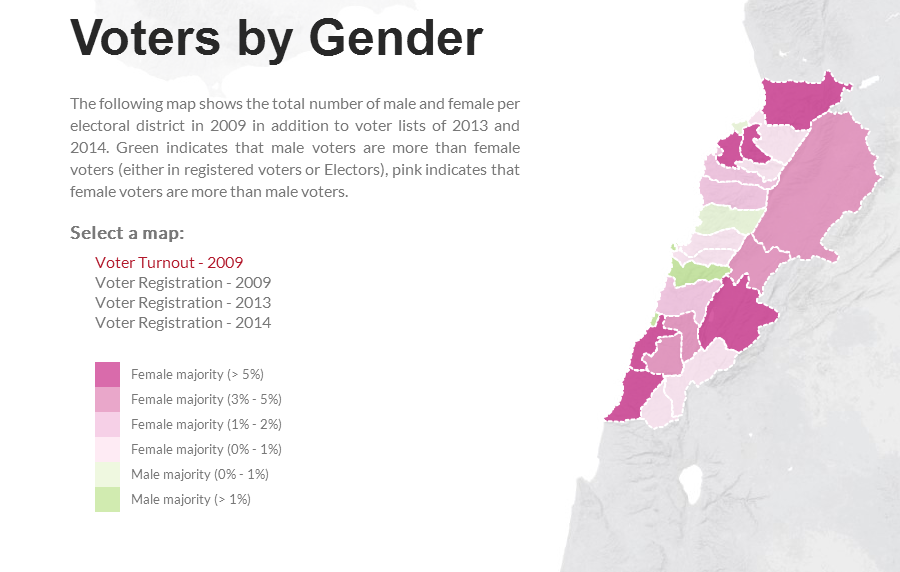
Map 35: Influence by gender based on the vote turnout of 2009
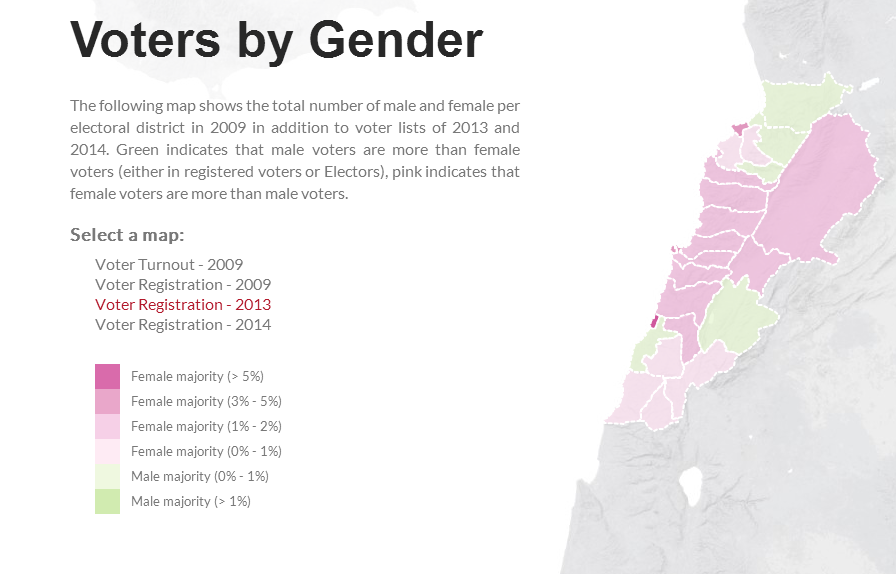
Map 36: Influence by gender based on the 2013 Voter registration

Map 37: Influence by Gender based on the 2014 voter registration
C- Vote Power (Number of registered voters/Number of MPs)
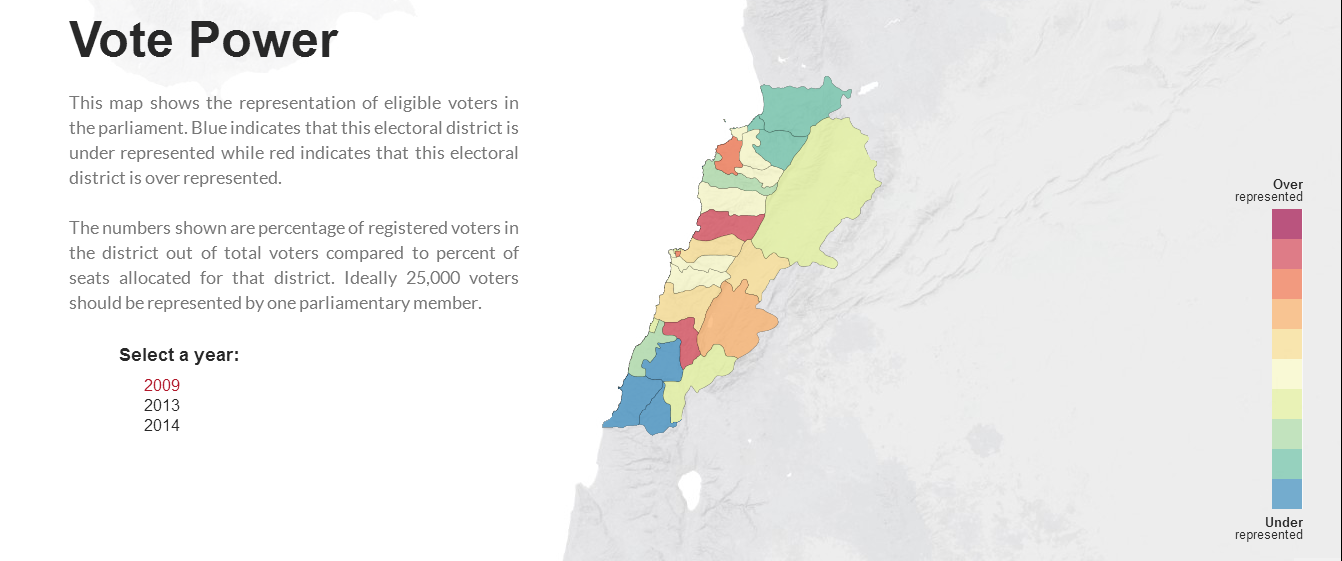
Map 38: Vote Power in 2009

Map 39: Vote Power in 2013

Map 40: Vote Power in 2014
Les Grandes Lignes
This is too much data to analyze, and basically every map can be reviewed on its own. However there are general observations common to most of the maps:
(1) Female voters are by far more influential than male voters. If you take a look at maps 34,35,36 and 37, you’ll hardly find any green. According to map 35, the only districts where the men were the majority of voters in 2009 are Aley, Beirut, Tripoli, Saida, and Keserwan.
(2) Christian percentages are mainly dropping everywhere (maps 1→21). And even when the percentages of a certain Christian sect in a certain district is rising, it usually reflects a much bigger drop by another Christian sect. For example, the Maronite percentage in Koura is the only one that became more important (the green spot in map 2), but this is only because the Greek Orthodox percentage of Koura is dropping even more (maps 4 and 5). Another interesting fact is that the Greek Catholics are having higher percentages in the Christian heartland (Northern Mount-Lebanon and the Southern parts of the North) while their percentages are massively dropping everywhere else (maps 7, 8 and 9). It could indicate that some Greek Catholics are changing their place of registration (which is the hometown) from the mixed districts to the Christian heartland.
(3) On the Muslim side, there’s an interesting trend among Shias and Sunnis. If you look at the maps 23 and 26, you realize that the Sunnis are becoming more populous in the Shia-majority districts (Look how much the south is green in map 23) while the Shias are having higher percentages in the Sunni dominated districts (Take a look at Beirut, Saida, Zahle, West-Bekaa and the Chouf in map 26).
(4) If you check maps 38→40, you’ll notice that the districts that are the most underrepresented are the Muslim and rural ones (mainly Akkar and the South).
(5) So to sum things up, on the long run, most of the districts tend to become more religiously mixed. For example take a look at the Greek Orthodox in map 5. The Greek Orthodox are having lower percentages in their heavyweight districts like Akkar, Marjeyoun, Koura, Tripoli, Aley and Beirut. Their percentages are however rising in the other districts where they are barely present (especially in the Christian heartland).
